COVID Excess Mortality
SNU project (Not published)
Prediction Interval of Random Forest
Definition of Excess Mortality
Excess Mortality is a term used in epidemiology and public health that refers to the number of deaths from all causes during a crisis above and beyond what we would have expected to see under ‘normal’ conditions.
- In terms of COVID-19, it is a useful measure of the total impact of the pandemic on deaths than the confirmed COVID-19 death count alone.
- There are several methods including comparing average death for 5 years and that of this year (Or \(t\) test to see the significance.)
- But this method is too simple in that every year mortality has been increased because of aging society.
GLM Method
EuroMOMO is a European mortality monitoring activity, aiming to detect and measure excess deaths related to seasonal influenza, pandemics and other public health threats.
- Mortality baseline is moidelled using a GLM poisson corrected for over dispersion.
- EUROMOMO ussed sine and cosine functions to adjust seasonality.
- Specifically, they estimate influenza attributed excess mortality using FLUMOMO, of which model is a multiplicative Poisson regression time-series model with overdispersion.
- FLUMOMO used weekly Influenza Activity (IA) and temperature data.
Limitation of GLM
- GLM assumed the distribution of data follows poisson distribution with overdispersion.
- Since GLM used sine and cosine functions to reflect the seasonality of mortality, and this is quite a strong assumption.
- GLM ignored correlation between features such that influenza activity and extreme temperature.
- GLM ignored serial correrlation structure of time series data.
Methodology
- Reflect sereial correlation structure of mortality data.
- Instead of considering correlation between features, only focus on mortality data. (There is no total mortality data of 2020, but monthly total mortality data in Korea).
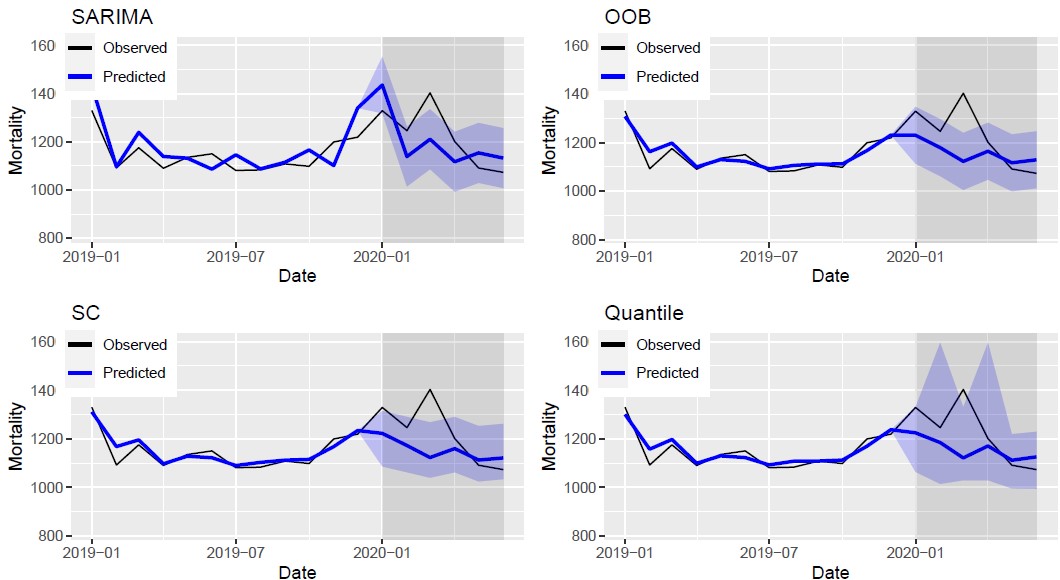
- Use 95% prediction interval to estimate an excess mortality in 2020 (During COVID-19 period).
- Thus, I used three Random Forest method and compare with SARIMA (Time series modeling).

- There is only one local which shows excess mortality (March 2020 Daegu).